Spatio-temporal Analyses of Motorcycle Traffic Accidents Case Study: Mashhad, Iran
Abstract
Motorcycle is known as one of the most frequently used transportation modes for different trip purposes. Motorcyclists are one of the most vulnerable users of the transportation system due to the low stability of the motorcycle and insufficient protection for passengers. This paper aims to detect spatio–temporal dependencies of motorcycle accidents (MAs) using bivariate global and local indicator of spatial association based on monthly analyses of aggregated motorcycle accidents over 253 traffic analysis zones (TAZ) in Mashhad, Iran for the successive three years (2006-2008) to investigate whether the accidents demonstrate cluster or disperse patterns of autocorrelation. The indicators were examined for number of motorcycle accidents that occurred in every TAZ in Mashhad for one month as the original variable and the spatial lag of number of motorcycle accidents for the next month as the second variable. The analyses were conducted separately for months of every seasons. The result of applying bivariate global autocorrelation statistics indicated significant global spatio-temporal pattern of clustering. In other words, it seems that motorcycle accidents in Mashhad have some kind of organized spatio–temporal patterns. More information on the type of clustering was provided by an analysis of bivariate local spatial autocorrelation indicators (BLISA). BLISA cluster maps for monthly motorcycle accidents have been extracted which indicate the patterns of clustering between motorcycle accidents per TAZ in one month and the average number of motorcycle accidents in the second month of study for its neighbours. Considering the fact that the results indicated the clustering of motorcycle accidents, the regions that needed to be particularly targeted with safety-attention programs are explored. It can provide some guidance for decision makers and intervention planners where they should implement intervention action plans. Therefore, the planners can appropriately allocate the limited budget and time for safety enhancements.
Global and Local Space-time autocorrelation
Global bivariate Moran’s I quantifies the spatial dependency between two variables in two units of time study in a same location. The resulting empirical reference distribution provides a way to evaluate how extreme the observed statistic is relative to its distribution under spatial randomness and will produce a Moran’s I scatterplot with the original variable on the horizontal axis and the spatial lag of the second variable (a weighted average of values of the second variable in the neighboring locations) on the vertical axis (variables are used in standard form).
Global spatial statistics' indicators do not provide any information on the exact location of clusters. On the other side, the global statistics might wrongly show that there is no relationship among data while there might be a strong correlation in different parts of the study area. Local Indicators of Spatial Association (LISA) provides a measure of association for each spatial unit (e.g., TAZs) and helps recognizing the type of spatial correlation.
Results of Bivariate Local Spatial Autocorrelation (BLISA)
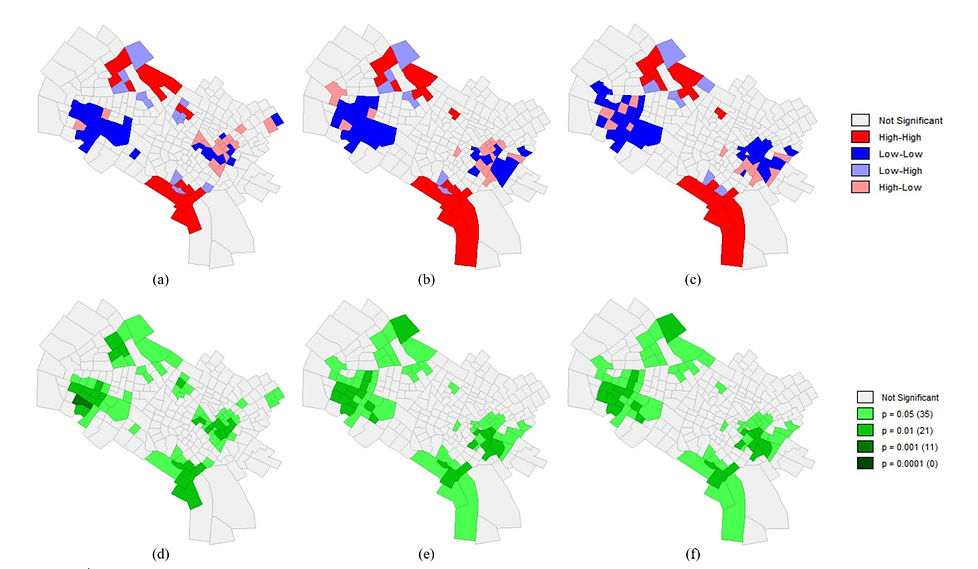
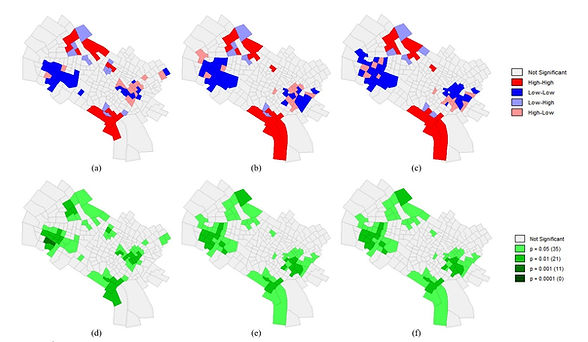
By way of illustration, BLISA cluster maps and its corresponding significant maps (for different permutations and p-values) for motorcycle accidents in the first month of spring (April) as the original variable and the spatial lag of motorcycle accidents in second and third months of the same season (May and June) as the second variable have been indicated in Figure a and Figure b respectively. Similar results for the second month of spring (May) as the original variable and the third month of the same season (June) as the spatial lag has been depicted in Figure c.
The results of BLISA inferred by local bivariate Moran’s I divide the study area into four sub-regions corresponding to the clusters (High-High and Low-Low), and outliers (High-Low and Low-High). Clusters refers to areas with positive BLISA and are depicted in the maps as high-high and low-low areas. The high-high (low-low) sub-regions are areas with high (low) motorcycle accidents in the first month of study which are also surrounded by areas with high (low) number of motorcycle accidents in the second month of study. Areas with negative spatial autocorrelations are also called outliers and are illustrated in the maps as high-low and low-high areas. Outliers may be the result of some form of error such as measurement, coding, representation etc. Such areas need to profoundly be investigated to understand what is going on in the TAZ.